
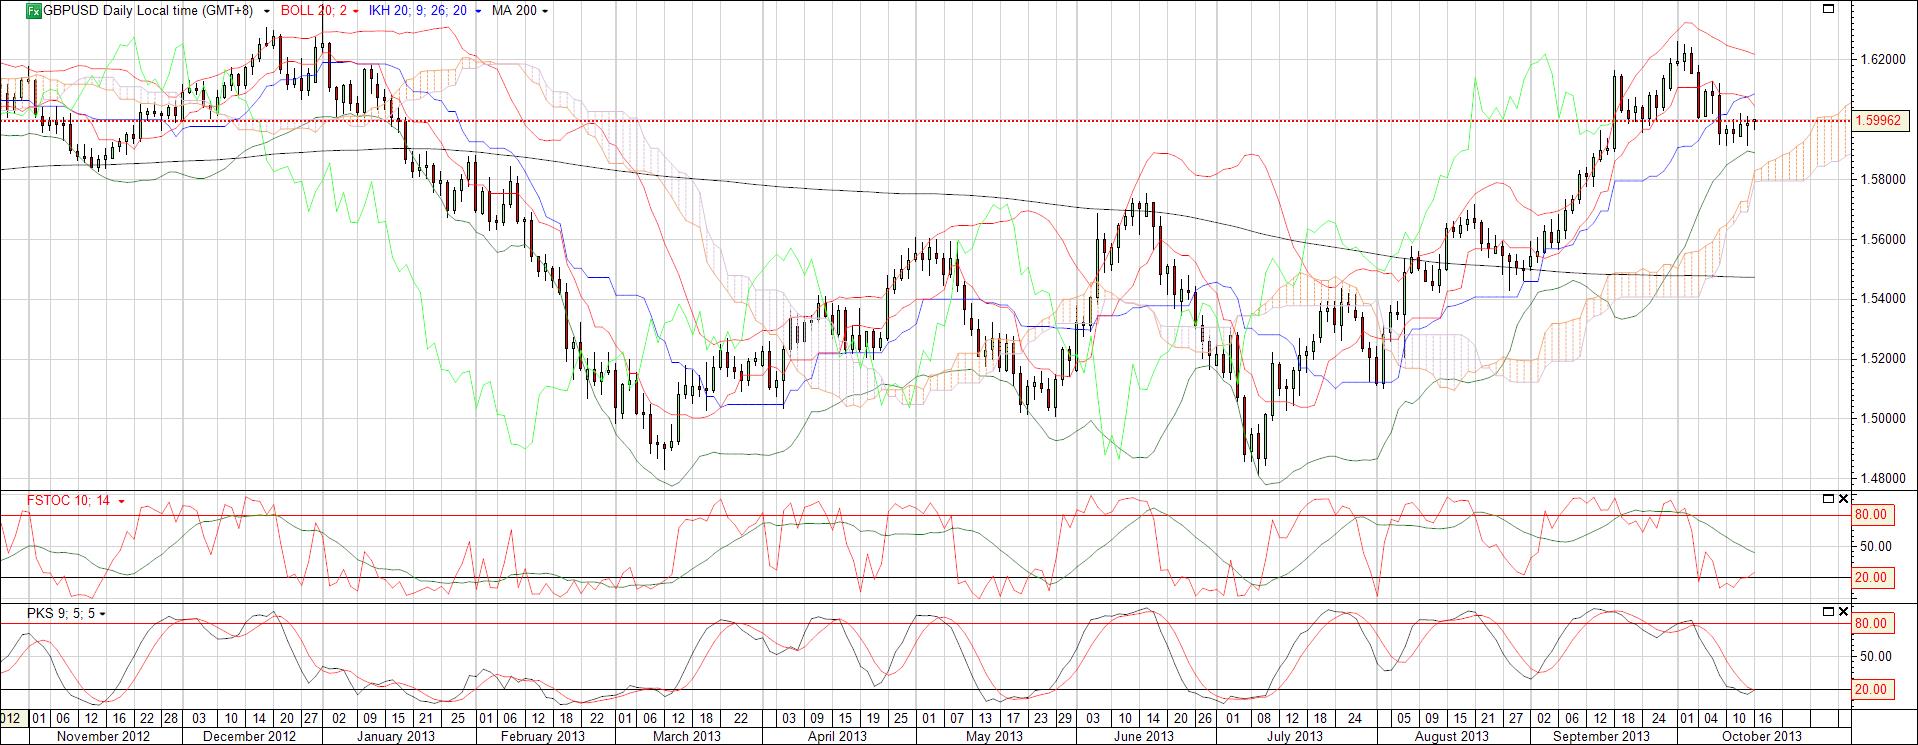
The daily chart shows a double bottom or a ‘W’, one leg in March and the other leg in July, affirming that for the near term, the bottom is well supported at about 1.4875. Recent top at 1.6225.
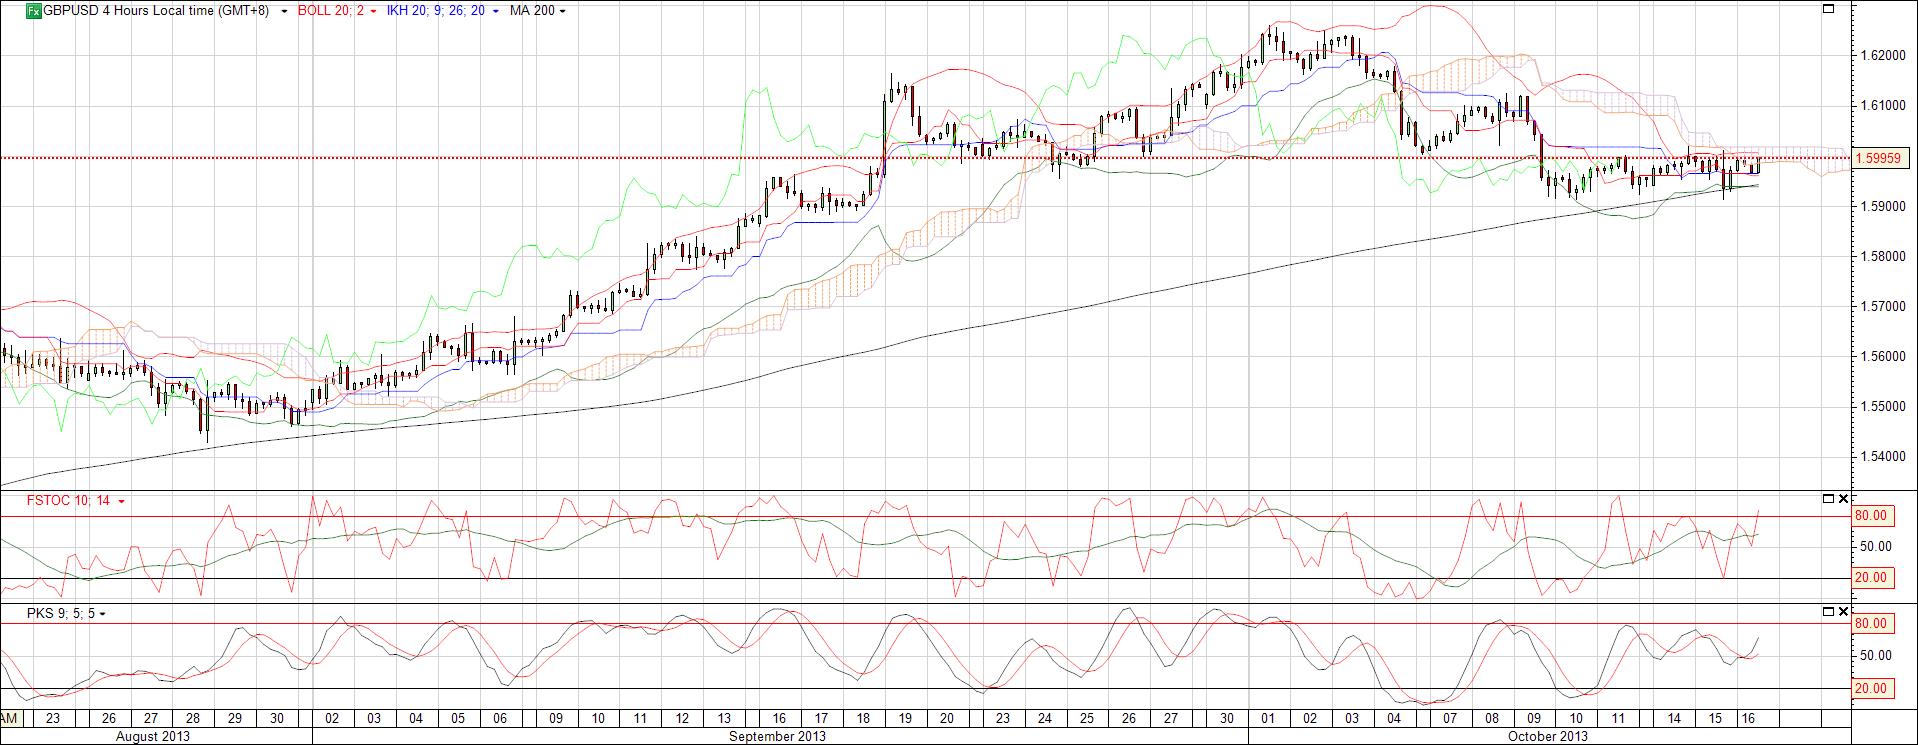
The 4 hourly chart is trending sideways just above the 200 day MA of 1.5942 and currently trading below the cloud. Bollinger bands are squeezed indicating a possible breakout.
The technicals tend to indicate a potential softening in the GBP, however, all bets are off the table because of the US crisis and the debt ceiling deadline tomorrow.
Making a calculated risk trade based on fundamentals or technicals is fine, as there is rationality and logic involved in the process, whether we win or lose will depend on how good our analysis was.
However, betting against politicians is always a losing proposition. Politicians cannot be trusted and are double headed snakes. Nonetheless, like Hollywood, the Americans love the melodramatic and I believe they will some relief to the financial markets when they announce a positive outcome at the 23rd hour 59th minute………….they usually do, just check back on the two previous times when they increased the debt ceiling limit within the past 14 months.
