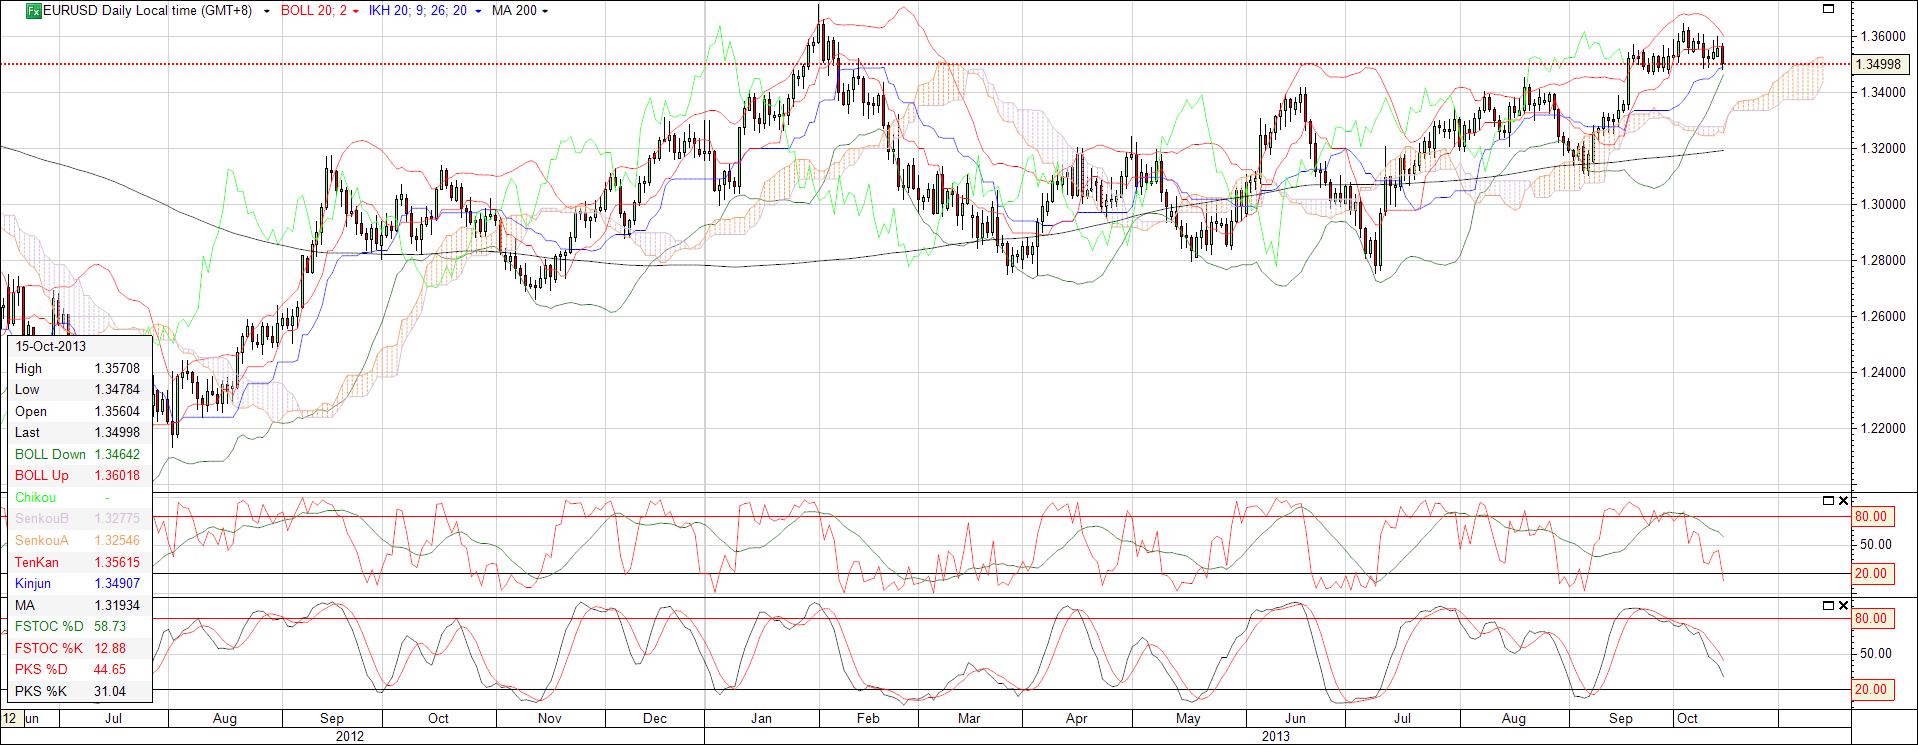
In the daily chart, recent highs in the EUR was at 1.3645 in February this year and the lows was in July at 1.27790 and the 200 day moving average at 1.3142.
Bollinger bands are squeezing into a bottleneck…………ready to burst…………and then again………..burst up or burst down??
Looking at the 4H chart, the signs are more compelling that the EUR may be at the start of another down trend, towards the low established in early September of 1.3110.

Could possibly be a good option trade, but I am just not comfortable with the US crisis and the debt ceiling deadline on Thursday. I really don’t want to lose bullets buying options only to give it up because the markets went crazy.