
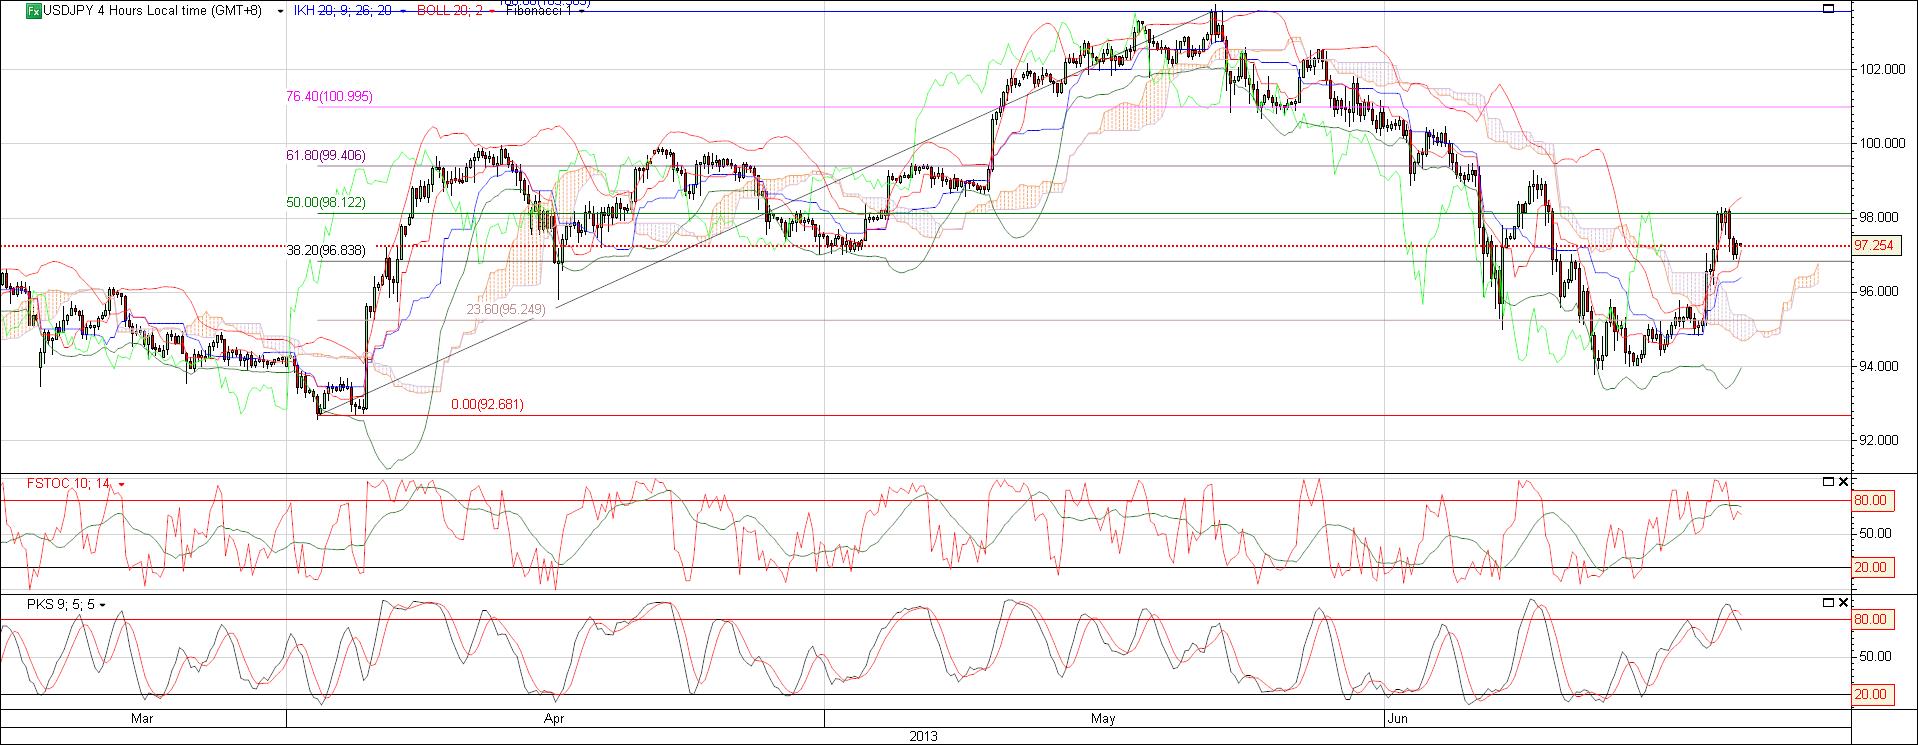
The appropriate and relevant price chart to look at is the 4 hour chart; it shows a high of 103.52 on 12 May and a low of 92.56 on 12 April. Moving averages has broken through the declining cloud though fast and slow stochastic is showing a downtrend tendency.
The 15 minute chart shows the yen trading in a short term band of between 96.21 and 98.25, about 2 big figure spread. Good opportunity to make quick profitable trades within the band.
I will shortly share some short term trade strategies with you.
