Skip navigation

Daily Archives: June 21st, 2013

Monday

———–

4pm  ~  EUR  ~  IFO Business Climate


Tuestday

————

8:30pm  ~  USD  ~  Durable Goods Orders

10pm  ~  USD  ~  New Home Sales


Wednesday

————–

5pm  ~  GBP  ~  Inflation Report

8:30pm  ~  USD  ~  Finalized GDP


Thursday

————

4:30pm  ~  GBP  ~  Current Account and GDP

8:30pm  ~  USD  ~  Unemployment Claims

10pm  ~  USD  ~  Pending Home Sales


I believe Tuesday and Thursday will be market moving days, so let’s get ready for it and make decent trading profits out of these opportunities.

Let’s not forget to do our homework.

Here’s wishing all a great weekend.

The AUDUSD has staged a phenomenal meltdown since April this year.  Imagine on 11 April, the AUDUSD was at 1.0581 and by 11 June it was at 0.9324, that is a 1,257bps move!!!!!!!!

The current spot at0.9230, a slight improvement from the post FOMC low of 0.9166.  Where is the AUD going, the target of 0.9200 has been hit.

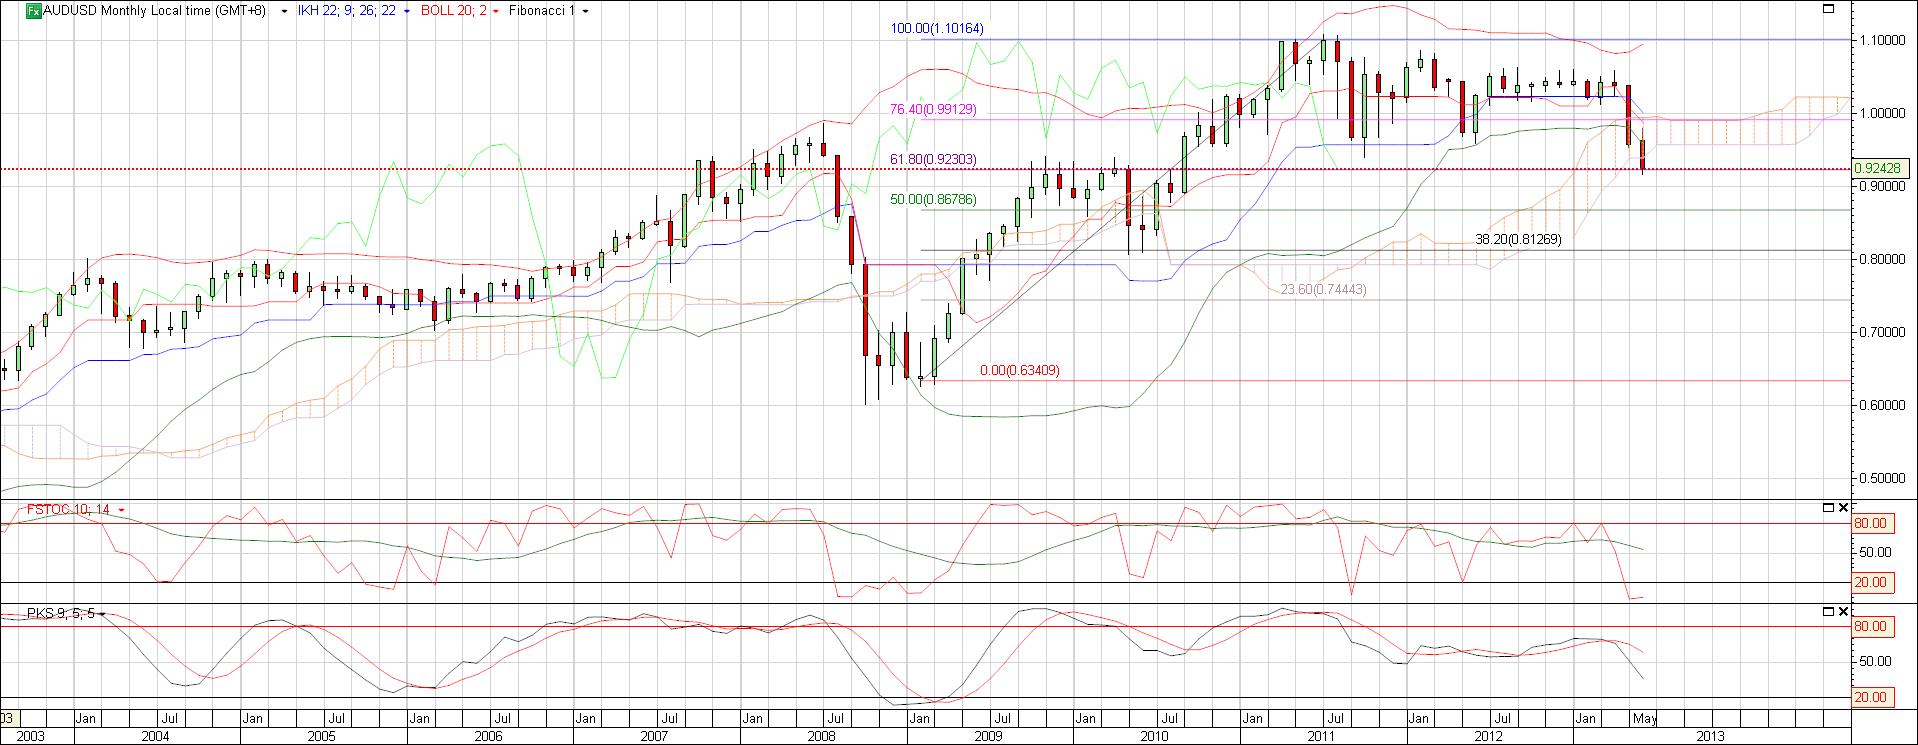
This is why we need to look at the monthly price chart: –

audusd_monthly chart_21 June 2013

The low was 0.6248 on 1 February 2008 and the high was at 1.1016 on 1 July 2012.

76.4%  ~  0.9912

61.8%  ~  0.9230

50%  ~  0.8678

38.2%  ~  0.8126

23.6%  ~  0.7443

Does the RBA necessarily need to continue easy monetary policy by reducing interest rates further?  I don’t think it needs to, the economy has lower debt compared to any other developed country.  Debt to GDP is also the lowest of any developed and matured economy.  Australia was not involve in the CDO and CMO crisis, it just practiced old fashion banking.  You are not going to be as exciting as the UK or the US, but Australia has less volatility and is more steady all around.

I believe at the current FX levels, it will help Australia to be export competitive for a developed country.  Pharmaceuticals, food and beverage are still very large export industries for Australia, besides, the traditional commodities and metal ores business.

Could AUD reach the 50% retracement level of 0.8678, it is possible, however, what will bring it there?

I believe the bottom is near and thereafter, we can take an opportunistic option trade to ride the upside.


The appropriate and relevant price chart to look at is the 4 hour chart; it shows a high of 103.52 on 12 May and a low of 92.56 on 12 April.  Moving averages has broken through the declining cloud though fast and slow stochastic is showing a downtrend tendency.

usdjpy_4 hourly chart_21 June 2013

The 15 minute chart shows the yen trading in a short term band of between 96.21 and 98.25, about 2 big figure spread.  Good opportunity to make quick profitable trades within the band.

I will shortly share some short term trade strategies with you.

Currently, EURUSD is trading at 1.3230, based on the daily Fibonacci, is trading above the 50% retracement level of 1.3172 and approaching the 61.8% 1.3284.  To give us a view of sensitivity, the high of 1.3644 happened on 1 February 2013 and the low of 1.2701 on 13 November 2012.  On a daily basis, the pattern is showing a potential downtrend.

eurusd_daily chart_21 june 2013

The 4 hour chart shows a high of 1.3408 on 19 June 2013 and a low of 1.2810 on 17 May, this is a 598bps difference which happened in a month.  the 76.4% retracement is at 1.3267 and the 50% level at 1.3109.  The current spot is below the cloud, however, creating some base with a potential uptrend developing.

The 15 minute chart shows that the EUR is trading in a short term band of 1.3164 and 1.3263, a 99 bps channel.  Current spot is staying above the cloud for now.

The Eurozone continues to languish with a mix of both good and bad economic data, the reality is that the various European economies are struggling to create economic growth.

I will be coming up with some opportunistic trading strategies soon, so stay tune.

Was the FOMC statement and thereafter the press conference by Bernanke………..staged?!

Why was the FOMC statement so lethargic and uninspiring, and then, the monumental statement by Bernanke where he for the first time announced timelines for the tapering of the QE; beginning year end and into 2014 with full withdrawal by mid 2014.

Wow………what an aggressive statement by the Fed Chairman when all previous times, he was skirting the issue.  Of course, he tried to culture the statement by saying that it is all data dependent.  Kind of like shooting someone first and then saying, let’s send him to the hospital so that he may or may not have a chance to live.

What is interesting is that the Fed also decided to change their two loved targets of inflation and unemployment.  Previously, the Fed had definitive targets of 2% for inflation and 6% unemployment rate before triggering tapering QE.

Now, they have changed specific targets to range targets; inflation has changed to 1.4% to 2% and unemployment rate 6.5% to 7%.  Let’s not forget that inflation is now at 1.1% and unemployment at 7.6%, so we are not so far from the range targets.

Is the Federal Reserve orchestrating the imminent tapering of QE because they are now worried about the fact that liquidity is not sufficiently moving into the real economy but instead is fueling real estate, equities and bond markets.

If the last three days was not a taste of the carnage to happen when the first installment of the cut in QE happens in October, we will definitely see widespread bloodshed at that time.