
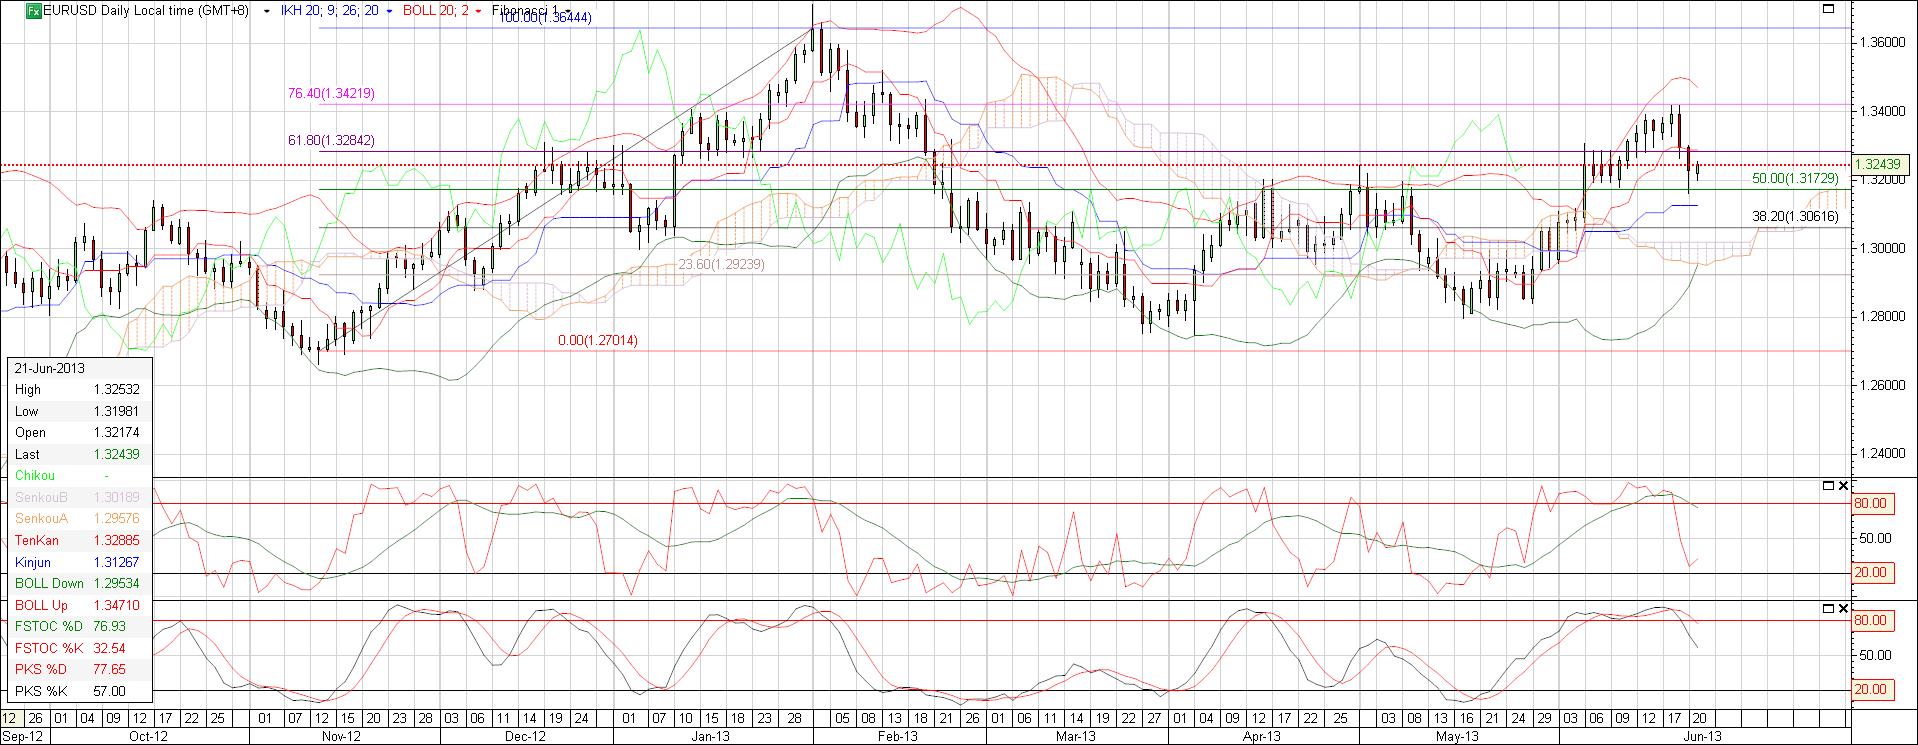
Currently, EURUSD is trading at 1.3230, based on the daily Fibonacci, is trading above the 50% retracement level of 1.3172 and approaching the 61.8% 1.3284. To give us a view of sensitivity, the high of 1.3644 happened on 1 February 2013 and the low of 1.2701 on 13 November 2012. On a daily basis, the pattern is showing a potential downtrend.
The 4 hour chart shows a high of 1.3408 on 19 June 2013 and a low of 1.2810 on 17 May, this is a 598bps difference which happened in a month. the 76.4% retracement is at 1.3267 and the 50% level at 1.3109. The current spot is below the cloud, however, creating some base with a potential uptrend developing.
The 15 minute chart shows that the EUR is trading in a short term band of 1.3164 and 1.3263, a 99 bps channel. Current spot is staying above the cloud for now.
The Eurozone continues to languish with a mix of both good and bad economic data, the reality is that the various European economies are struggling to create economic growth.
I will be coming up with some opportunistic trading strategies soon, so stay tune.
